A map showing the environmental pressures from global food production has been developed by researchers, to identify ways of creating more sustainable and just food systems.
The analysis looked at greenhouse gas emissions, water use, habitat disturbance and pollution, such as effluent or fertiliser run off from farms.
The study, by the University of Leeds and the University of California Santa Barbara, revealed that almost half of all environmental pressures from food production came from just five countries - India, China, the United States, Brazil and Pakistan.
The study also showed that more than 90% of the environmental pressures from land-based food production were concentrated in just ten percent of the Earth’s surface. In addition, the space required for dairy and beef farming accounts for about a quarter of the cumulative footprint of all food production.
This “big picture” spatial analysis is helping to identify problems in food production but also opportunities.
Dr David Williams, from the School of Earth and Environment at Leeds and one of the authors of the study, said: “Providing adequate and nutritious food for eight, nine, or ten billion people will inevitably have a huge impact on the environment.
“So, it is vital that we understand where those impacts are felt, which foods are really driving them, and can identify leverage points to make the whole system more sustainable. And we can only do that by looking at the big picture.”
Lead author in the study, Dr Ben Halpern, from the National Center for Ecological Analysis and Synthesis at the University of California Santa Barbara, said figuring out the impact of global food production was a gargantuan task, because there are many foods around the world, and they tend to be produced in different ways.
He said a more comprehensive examination of the locations affected by the various pressures from food production and the severity of that pressure was needed to help make sustainable decisions about how to feed the world’s booming population.
The study also examined the environmental efficiency of food types.
For instance, thanks to technology that reduces greenhouse gases and increases yields, the United States - the world’s number one producer of soy - is more than twice as efficient as India (the fifth largest producer) at producing the crop, making American soy the more environmentally friendly choice.
The research also uncovers connections between land and the sea that get missed when only looking at one or the other and that result in significant environmental pressures. Pigs and poultry have an ocean footprint because marine forage fish such as herrings, anchovies and sardines are used for their feed.
The opposite is true for mariculture farms (fish farms), whose crop-based feeds extend the fish farms’ environmental pressure on to land.
Assessing cumulative pressures can bring to light results that could not have been predicted by examining individual pressures alone. For instance, while cattle raising requires by far the most grazing land, the cumulative pressures of pig farming, which produces a lot of pollution and uses more water than cattle farming, turns out to be slightly greater than that of cows.
The research - The environmental footprint of global food production - is published in the journal Nature Sustainability.
*Researchers at Leeds have developed a calculator that could be used to reduce the carbon emissions linked with food production.
Further information
For more details, please contact David Lewis in the Press Office at the University of Leeds by email on d.lewis@leeds.ac.uk.
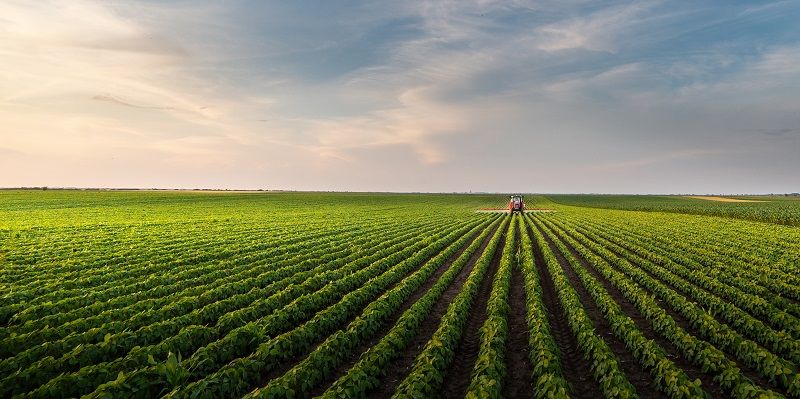
The top image shows a field of soybean. Adobe stock.